Engagement & Retention project | Instacart
Product Hook
Problem statement
Grocery shopping is a family affair, for singles (ICP-1) they have roommates often sharing the apartment rent and other memberships like Netflix, Phone plans etc. For families (ICP-2), there is spouse or grown-up kids - from high school to staying in college dorms. They all have their plus ones or even more. Therefore, providing a common cart, with all their selected items to be shopped, and even with individual shopping at different addresses or different payment methods when personal items or quick orders are placed, becomes a need. With genZ or millenials, they both need their friends/families to pitch in when ordering groceries or food from restaurants with reviews/suggestions.
Current alternative
Offline retail shopping store. Many shoppers have purchased a common costco membership and go out to buy with their plus ones. In case of roommates, they do the bill sharing manually which is extremely pain in the rack. With families, sometimes when one spouse is busy taking care of kids or work, the other half takes a list and go out for shopping - don't forget the call to put the missing item in the list, an always last minute thing!
Metrics to track
Order frequency; Average order value; Revenue
Solution - Summary and Detailed version
Family Member Added to Instacart Account of Primary Holder/Owner!
|
|
|


Engagement Campaigns
Campaign #1
User Segmentation | Casual to core and core to power |
|---|---|
Goal | Encourage users to refer friends or family members to increase order frequency and Average order value |
Pitch | Collaborate with friends and family - create carts, share premium membership benefits, switch to individual shopping anytime |
Channel | Email, app nudge, splash screen |
Offer | Get $25off when you add a member and they place their cart order |
Frequency | Once a month |
Timing | Email - weekends, app nudge - between 6-10pm weekdays; splash screen - when an order is delivered and user gives 3+ rating |
Metrics | Number of user added, average order value, order frequency per month |
Campaign #2
User Segmentation | New User and Casual to core |
|---|---|
Goal | Make the user experience the convenience of home delivery within minutes and different stores available within one app |
Pitch | Get Instacart membership completely free for a month |
Channel | Email, splash screen on app |
Offer | $0 delivery fee for groceries, minimum order $10; $0 delivery fee for restaurants, minimum order $35; get cancelation reminder 3 days before trial ends! |
Frequency | For new user - once a week; for casual user - once a month |
Timing | Immediately when the user goes to checkout page and places an order |
Metrics | Number of premium members, order frequency, average order value |
Campaign #3
User Segmentation | Casual to core |
|---|---|
Goal | Increase the number of orders for a casual user and save their time |
Pitch | Congrats, you are on track to be a time
Your items are on sale!! Hurry to order now |
Channel | App nudge, email and text |
Offer | Get 20% off on your buy again items list, get them delivered in 60 minutes at one-click |
Frequency | 10 days after last order |
Timing | Email - Friday evening, App nudge and texts - Sat/Sun noon |
Metrics | Order frequency, repeat orders |
Campaign #4
User Segmentation | Core to power user |
|---|---|
Goal | Get the core users to order from stores other than their regular shopping store |
Pitch | Surprise your partner with a beauty care kit - get 15% off on beauty stores; Got a little cute 4-legged family member - we love them too. Get 15% off on pet care/supplies products; Show love & gratitude, reciprocate with a thoughtful gift - get 15% off on items under gift tabs. Checkout the app now or click here! |
Channel | Email, app nudge, text |
Offer | Get 15% off on pharmacy, convenience, shop & stop, pet supplies etc. |
Frequency | Once a month, for gifts - it can be during the holiday or festival week. |
Timing | 6pm - 10pm |
Metrics | Number of stores per user, average order value, frequency of orders |
Campaign #5
User Segmentation | Casual to core, core to power |
|---|---|
Goal | To encourage users to experience Instacart new offering of restaurant deliveries powered by UberEats |
Pitch | Hungry? Order in with restaurants. Get cozy on the couch and check out the restaurants tab on Instacart! |
Channel | |
Offer | Get 50% off your first restaurant food order |
Frequency | Once a month |
Timing | 6pm - 7pm on weekdays and 11am on weekends |
Metrics | restaurants order frequency, average order value |
For Instacart, we have an app and website hence we focus on these only for user retention.
56% of Instacart customers come back in the year after first purchase, exceeding that of Costco, Walmart, and regular grocery stores. Source: https://www.goodwatercap.com/thesis/understanding-instacart-serving-the-best-grocery-customers-in-the-industry

In Q2 2023, Instacart Delivery’s quarter-over-quarter U.S. customer retention was 61 percent.
Instacart’s retention rate remained relatively unchanged compared to Q1 2023 and most quarters of 2022, but it was higher than its customer retention rates seen throughout most quarters of 2020 and 2019.
Source: https://secondmeasure.com/datapoints/instacart-ipo-grocery-delivery-sales/#:~:text=In%20Q2%202023%2C%20Instacart%20Delivery%27s%20quarter%2Dover%2Dquarter%20U.S.,throughout%20most%20quarters%20of%202020%20and%202019.
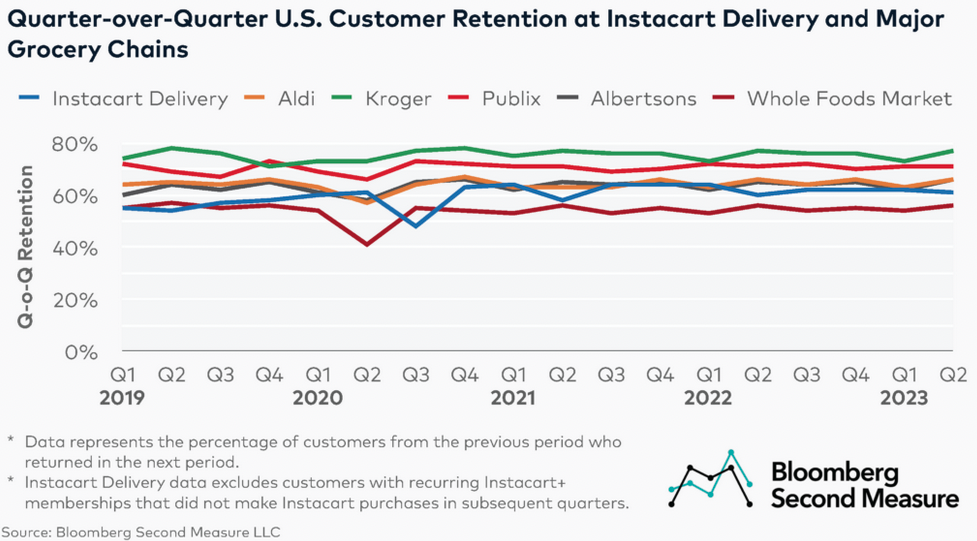
Retention Rate Flattening
We can view in the above chart that the retention rate of Instacart flattens around 60%.
Here's a breakdown of Instacart's acquisition channels:
Source: https://www.coolest-gadgets.com/instacart-statistics/#:~:text=By%20Traffic%20Source%20*%20InstaCart%20Statistics%202024,0.1%%2C%20and%20display%20ads%20make%20up%200.35%.

- Direct Searches:
65.77% of traffic comes from users directly typing "instacart.com" or similar URLs into their browsers. - Organic Search:
15.07% of traffic originates from users finding Instacart through organic (unpaid) search engine results. - Paid Search:
13.81% of traffic comes from users clicking on Instacart ads in search engine results. - Referrals:
4.34% of traffic is generated by users clicking links from other websites or platforms. - Social Media:
0.56% of traffic comes from social media platforms like Facebook and Instagram. - Emails:
Less than 0.1% of traffic comes from users clicking links in Instacart's email campaigns. - Display Ads:
0.35% of traffic comes from users clicking on Instacart ads displayed on other websites.
The above indicates the strong word of mouth for Instacart as most users come directly to use the product!
ICPs driving retention:
- In October 2024, approximately 60.96% of InstaCart users were women, and 39.04% were men.
- The InstaCart Statistics also show that users aged 25 to 34 make up 26.1% of the site's visitors, the largest age group.
- About 19.45% of InstaCart Player's website visitors are people aged 35 to 44.
- Meanwhile, 18.44% are between 45 and 54 years old, and 15.67% are aged 55 to 64.
- About 9.42% of the visitors to instacart.com are 65+, while people aged between 18 and 24 make up 10.92% of the website's users.
- In October 2024, InstaCart Statistics reported that 43.69% of people visit Instacart's website using desktops, while 56.31% access it from their mobile devices.
Hence, both our ICPs that we defined earlier are drivers of retention for Instacart. The core and power users buying for reasons ranging from needs to convenience, typically ordering $1000 per month with 4+ order frequencies.
Reason to churn:
Churn Reason | Type |
|---|---|
Higher fees - delivery, services, tip etc | Voluntary |
Death or major illness | Involuntary |
Higher markup prices than stores | Involuntary |
Memberships of other retailers like Costco, Whole Foods etc. | Voluntary |
Shopping preference shifted more towards in-store versus online - better selected quality of groceries, flowers etc | Voluntary |
Unable to utilize the stores due to reduced needs | Voluntary |
Higher minimum order value - $35, hence less frequent orders | Voluntary |
Poor communication with shoppers, not able to get selected item due to out of stock or the shopper couldn't find it - hence need to visit in-store. Poor customer support/service | Voluntary |
Negative actions for churn:
| Negative Action | Reason |
|---|---|
Email unsubscribe | Users opt out from discounts, offers and other perks sent via email |
Increased returns/refunds | This means higher dissatisfaction due to bad items delivered or even missing items |
Low delivery ratings | Issues with delivery or shoppers indicating bad experience |
Didn't purchase membership after long usage | Unable to find value in the product and do not want to save on membership perks |
Purchased only from one store | User his loyal to one particular store and prefers to purchase from there only, either shop in-store or check Instacart for in-stock items only |
Cart abandonment | Users finding higher markups price or higher delivery/service/other fees |
Not availing favorite store discounts or frequently purchased category offers | This means less frequent orders as the user is not coming back to purchase basic essential items or groceries again |
Brand focused courses
Great brands aren't built on clicks. They're built on trust. Craft narratives that resonate, campaigns that stand out, and brands that last.


All courses
Master every lever of growth — from acquisition to retention, data to events. Pick a course, go deep, and apply it to your business right away.


Explore courses by GrowthX
Built by Leaders From Amazon, CRED, Zepto, Hindustan Unilever, Flipkart, paytm & more
Course
Advanced Growth Strategy
Core principles to distribution, user onboarding, retention & monetisation.
58 modules
21 hours
Course
Go to Market
Learn to implement lean, balanced & all out GTM strategies while getting stakeholder buy-in.
17 modules
1 hour
Course
Brand Led Growth
Design your brand wedge & implement it across every customer touchpoint.
15 modules
2 hours
Course
Event Led Growth
Design an end to end strategy to create events that drive revenue growth.
48 modules
1 hour
Course
Growth Model Design
Learn how to break down your North Star metric into actionable input levers and prioritise them.
9 modules
1 hour
Course
Building Growth Teams
Learn how to design your team blueprint, attract, hire & retain great talent
24 modules
1 hour
Course
Data Led Growth
Learn the science of RCA & experimentation design to drive real revenue impact.
12 modules
2 hours
Course
Email marketing
Learn how to set up email as a channel and build the 0 → 1 strategy for email marketing
12 modules
1 hour
Course
Partnership Led Growth
Design product integrations & channel partnerships to drive revenue impact.
27 modules
1 hour
Course
Tech for Growth
Learn to ship better products with engineering & take informed trade-offs.
14 modules
2 hours
Crack a new job or a promotion with ELEVATE
Designed for mid-senior & leadership roles across growth, product, marketing, strategy & business


Learning Resources
Browse 500+ case studies, articles & resources the learning resources that you won't find on the internet.

Patience—you’re about to be impressed.